Summarize the information by selecting and reporting the main features, and make comparisons where relevant. You should write at least 150 words.
Where the money goes
 |
| Pie chart |
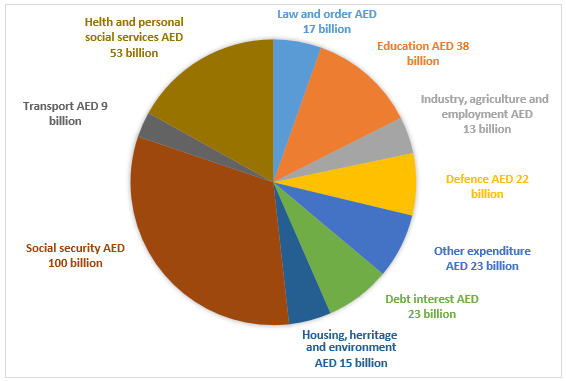
The pie chart shows the national expenditure of the United Arab Emirates government in 2000.
Overall, the UAE government had a budget of over 300 billion AED and the highest portion of this budget was spent on social security and health & social services.
As is given in the diagram, the UAE government spent more than 300 billion AED in ten different sectors in 2000.
As is given in the diagram, the UAE government spent more than 300 billion AED in ten different sectors in 2000.
Social security for the citizens cost the highest budget and it was exactly 100 billion AED.
Health and personal social services, on the other hand, required more than 50 billion and this was the second largest budget money allocation for the UAE government in 2000.
The UAE authority used 38 billion for education, 17 billion for law and order and 13 billion for job, industry and agriculture.
Defence sector cost them 22 billion that was slightly lower than the debt interests the government paid in this year.
Housing, heritage and environment got 15 billion which was nearly the same as it was allocated for law and order.
Finally, 9 billion was spent on the transportation sector and 23 million for other sectors which are not specifically mentioned in the chart.


0 Comments